The following table on page 4 of GE’s Q3 earnings release webcast presentation got me very excited as a financial analyst.
There’s a lot we can learn and predict about GE’s Industrial margins from this little table. I love puzzles, including “backing up” into a company’s numbers. Here we go….
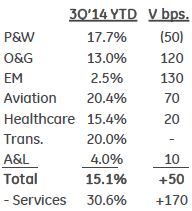
How much margin does GE make on services and equipment?
If 3Q’14 YTD Operating Margin was 15.1% (of revenue) in total, with services at 30.6%, then we need the split between service and equipment revenue to calculate the equipment margin. The 2013 annual report tells us that the split of industrial revenue is about 28% services and 72% equipment. If we assume a similar revenue split for 3Q’14 YTD, then we can use the weighted average method to back into the equipment margin.
We have an equation with one unknown: Equipment margin * equipment as % of total revenue + Service margin * service as % of total revenue = Total margin. Equipment margin * 72% + 30.6% * 28% = 15.1%. Therefore equipment margin is (only) around 9.1%.
It would get even more interesting if we had service and equipment margins, and the service/equipment revenue split, by business, but understandably GE does not provide this level of detail (you don’t want to give away that level of confidential information to your competitors).
Where will GE’s Industrial OM% be for total year 2014?
GE achieved 15.1% Operating Margins in the Industrial business 3Q’14 YTD, which is up 50 basis points (bps) versus last year’s number must have been 14.6% 3Q’13 YTD. Total year margins in 2013 were 15.7%, i.e. 110 basis points (1.1%-pt) higher than the 3Q’13 YTD number. Q4 is a very high margin quarter for GE, last year @ 18.3%. Last year, around 29% of total year Industrial revenue came in Q4, it therefore also has a disproportionate impact on the total year margin (volume leverage: variable costs go up with revenue, base costs stay fairly flat). If total year margins in 2014 are (like last year) 110 bps higher than 3Q YTD, and/or total year is up 50 bps (like 3Q’14 YTD was), then GE should be able to reach at least 16.2% Industrial OM% for the total year (a nice progression versus 14.8% in 2011, 15.1% in 2012, 15.7% in 2013).
However, the “SG&A (Selling, General and Administrative Expenses) reduction” chart leads me to be more optimistic.
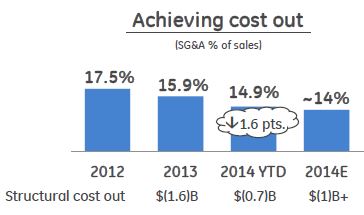
For total year, this estimate (published on October 17, with the Q3 earnings release) says that SG&A will be reduced by around 1.9%-pts for the year (excluding restructuring), gaining even more traction than the Q3 YTD cost-out performance. Furthermore, GE continues to expect a positive value gap (selling price versus purchase price developments) for total year, which helps margins. I am not quite sure of the effect on average margins of the strong Power & Water volume expected in Q4: as a business Power & Water is above average in margins, however equipment is at lower margins than services.
All in all, 80 bps to 100 bps, in other words a total year Industrial OM% of 16.5% to 16.7% might be possible, in my (subjective) opinion. If that turns out to be the case, it might a large positive surprise for investors, and a sign that GE does deliver on key commitments!