EBIT and EBITDA are probably terms that you company’s CEO and CFO use often, and expect you to understand as well. Would you like to know what EBIT and EBITDA mean, and while doing so get a quick refresher on what’s in the financial statements, what an income statement looks like from “top line” to “bottom line”, and what depreciation means? All of these are included in this short 6-minute video! Enjoy!
The registration date for the GE-Synchrony exchange offer is fast approaching, as the deadline is November 16. At first sight, it looks like a one-time 7.5% “free lunch” return is available to the agile investor. However, this begs the question whether “free lunches” exist, or whether every expected return is matched to its risk level instead. I tend to favor the latter view on the world. In this blog posting, I am sharing my personal considerations as a small private investor. I am in no way providing investment advice, but can hopefully clarify which key items you should consider when evaluating the offer.
2015 is proving to be an exciting year for GE: receiving regulatory approval for the acquisition of Alstom’s Power and Grid business, announcing and making significant progress in selling most of GE Capital in order to become “a new kind of industrial company”, a sizeable investment by activist shareholder Trian (of disruptive DuPont fame) in GE shares, and solid financial results quarter after quarter. Year-to-date Nov 6 2015, the share price is up 18% (all of which actually materialized since late September), so shareholders are seeing some positive returns due to the heightened attractiveness of the company and the improving prospects for its future.
All of these were fairly passive events for the average shareholder. But now GE gives shareholders something to choose, with the announcement of the GE – Synchrony Financial exchange offer. Basically, the question is: would you like to swap some or all of your GE shares for shares of Synchrony Financial? For each $100 of GE common stock accepted in the exchange offer, you will receive approximately $107.53 of Synchrony (SYF) common stock, subject to an upper limit of 1.1308 shares of Synchrony common stock per share of GE common stock.
Here are my suggestions of key items to think about when you evaluate the offer:
- Recent share price development of GE and SYF. GE seems to be getting a lot of favorable press recently, and positive upward share price dynamics might continue. SYF has steadily risen in share price since its introduction on the NYSE, from mid-$20s to mid-$30s. A word of caution: as GE currently owns the vast majority of SYF shares, there is a very limited free float (publicly tradeable shares) for SYF so far, and therefore the swings in share price could be following unusual patters! In order to judge the relative performance of the shares, a comparison to relevant stock index benchmarks would be appropriate (assuming there is such as a things as “meaningful industry peers” for each of these unique companies). To fully consider investor returns, it is also important to take into account the high dividend yield on GE shares (whereas SYF pays no dividend yet), and the risk profile (GE as a diversified company, while SYF has a “single business” focus).
- Future potential for the respective shares. If I had at least a full week available (which I don’t) to construct my own financial models of expected revenue, profit and free cash flow growth for GE and SYF for the next decade(s), based on a thorough analysis of all available company and industry information, I surely would. When looking at the median advice of stock market analysts, both companies seem to have high single-digit to low double-digit share price increase potential, with SYF prospects possibly above those of GE. If the exchange offer gets executed, GE will retire the GE shares offered by shareholders in the exchange, increasing the EPS (Earnings Per Share) growth of the company, and making the GE shares more scarce (relatively speaking, there will still be more than 9 billion of them outstanding), which could increase the GE share price.
- Portfolio considerations: if you did not hold a position in either GE or SYF yet, then would you like to invest in a diversified globally operating industrial company with huge backlog, improving operating margins, and a stable high-margin service business, or a single-play financial institution in the US market (largest provider of private label credit cards in the United States)?
- Recent share split / spin-offs of other companies. I own shares in Dupont (DD), which has been a rollercoaster ride in 2015, up and down between $50 and $70. In its split-off of the former Performance Chemicals division now named Chemours (CC), DuPont common stockholders received one share of common stock of Chemours for every five shares of DuPont common stock. However, the split has not been a happy story: Chemours stock has tanked from $16 down to $7 in the four months since its introduction. I also own shares in healthcare device company Baxter, and have this summer received one share of Baxalta (its former biotech division) for each share of Baxter. The sum of the Baxter and Baxalta share prices has not moved much since the split, providing for (at most) a “neutral” feeling on my side on that spin-off (though that might change if either Baxter or Baxalta comes “in play” as an acquisition target).
- Earlier spin-offs by GE. Genworth (insurance) comes to mind! Introduced to the New York Stock Exchange at $19.50 in 2004, Genworth stock went up all the way to $35 in 2007, but currently trades below $5 (riding the rollercoaster up and down, like so many financial stocks since the start of the financial crisis). GE initially sold 30 percent of life and mortgage insurer Genworth Financial Inc. in May 2004, and subsequently sold the remaining 70% in further increments at higher share prices, making it a successful spin-off when seen from the GE perspective.
- Transaction costs and speculation. If you wanted to benefit from the 7.5% “bonus” in the GE-SYF exchange, you could buy (additional) shares in GE, register them for conversion, then sell the SYF shares, and see whether you made a profit. The potential success of this strategy is obviously very dependent on the transaction costs you incur on the buying and selling, as well as any market positions that (other) speculators may have taken on GE and SYF shares. If there is a massive sell-off of SYF shares after the conversion, and a subsequent drop in the share price, the 7.5% “bonus” might quickly evaporate.
- Abundant liquidity. In the current economy, where central banks continue to increase the money supply and keep interest rates low, investors have plenty of liquidity available and look for opportunities to invest and make a solid return. The sale of various parts of GE Capital has progressed ahead of plan in terms of timing, this could be an indication that SYF might also be an attractive investment opportunity.
- Endowment effect and inertia. How many investors are going to make the effort to read the exchange offer documents, and/or take the step to actually register their GE shares for conversion? How many have an “emotional attachment” to their GE shares, and no “feelings” yet for SYF shares? Psychology and behavioral economics studies have shown that the default choice for many people in complex situations is to stay with what they know or have, rather than venture into the unknown. Based on that, the number of shares that will be registered for the offer may be low.
- Risk factors, including but not limited to:
- One of the many clauses in the exchange offer, is that GE is not required to complete the exchange offer unless at least 634,743,750 shares of Synchrony common stock will be distributed in exchange for shares of GE common stock that are tendered in the exchange offer. In total, 705,270,833 shares of SYF are made available by GE in the exchange, so the offer has to be nearly fully subscribed for GE to execute it.
- If the upper limit is in effect, you will receive less than $107.53 of Synchrony common stock for each $100 of GE common stock that you tender based on the Average GE Price and Average Synchrony Price, and you could receive much less.
- GE may have to limit the number of shares of GE common stock that it accepts in the exchange offer through a proration process.
In summary….. As the prospectus says: “Whether you should participate in the exchange offer depends on many factors. You should examine carefully your specific financial position, plans and needs before you decide whether to participate, as well as the relative risks associated with an investment in GE and Synchrony…… You must make your own decision after carefully reading this prospectus, and the documents incorporated by reference, and consulting with your advisors in light of your own particular circumstances. You are strongly encouraged to read this prospectus in its entirety, including any documents referred to or incorporated by reference herein, very carefully.” I fully agree! It seems that every expected return is matched to its risk level after all!
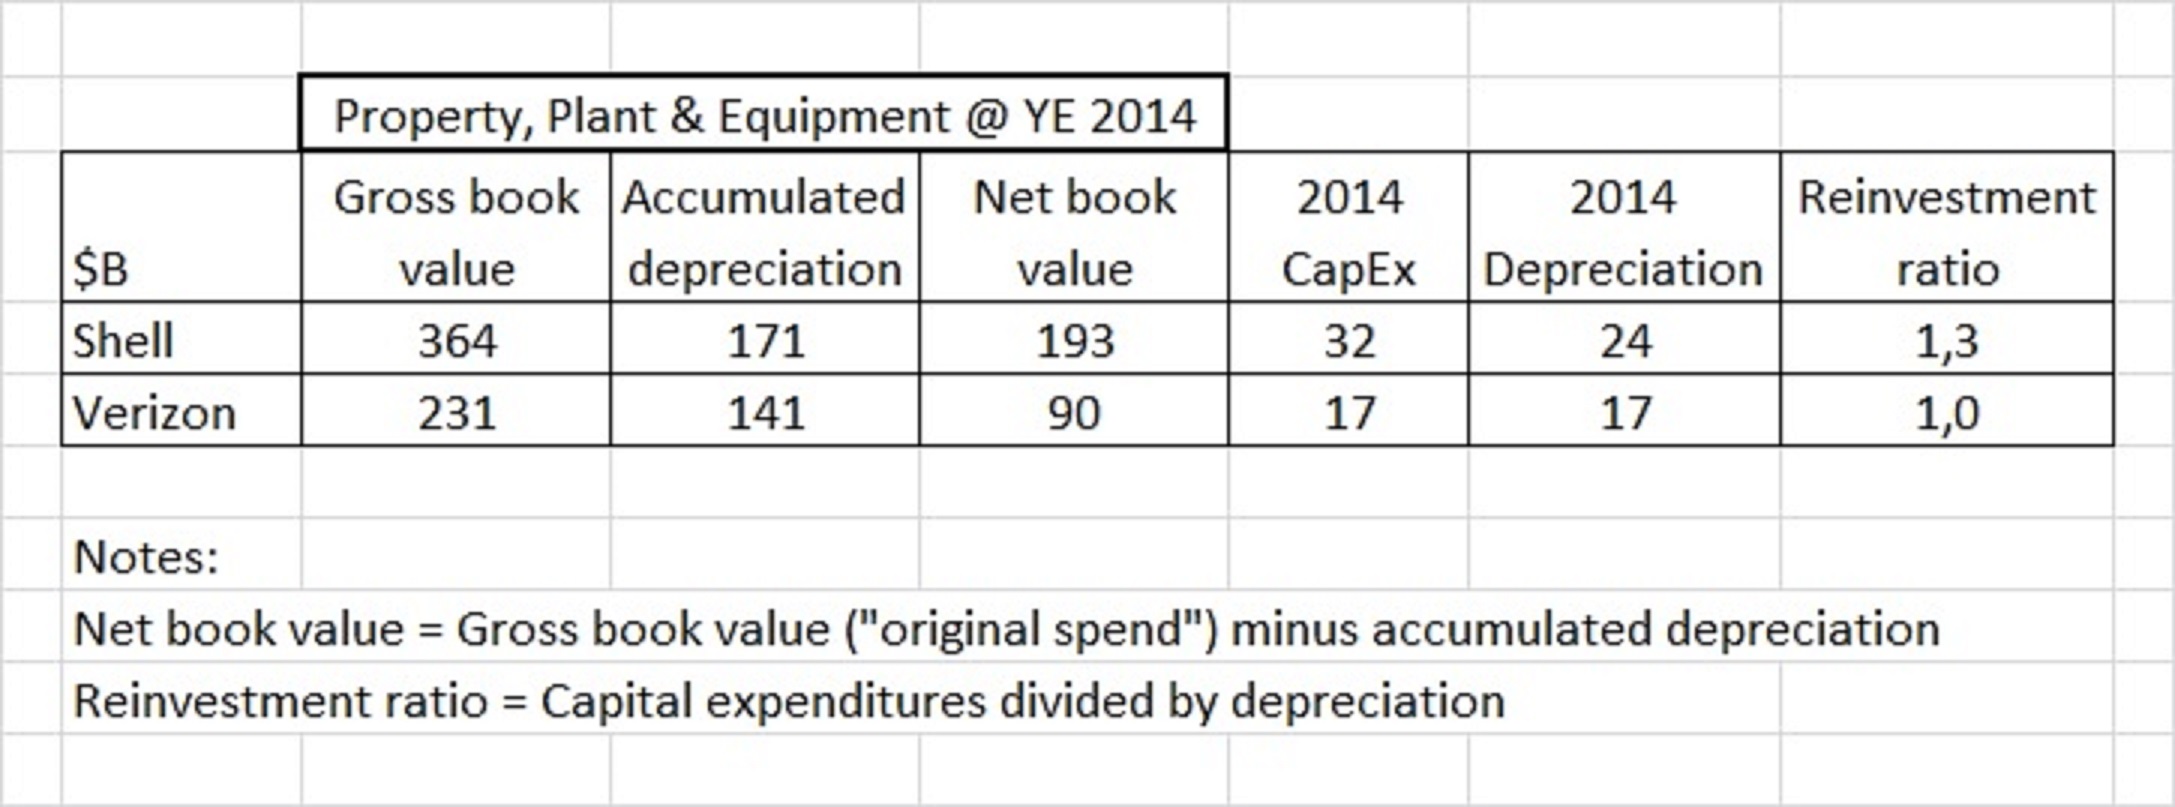
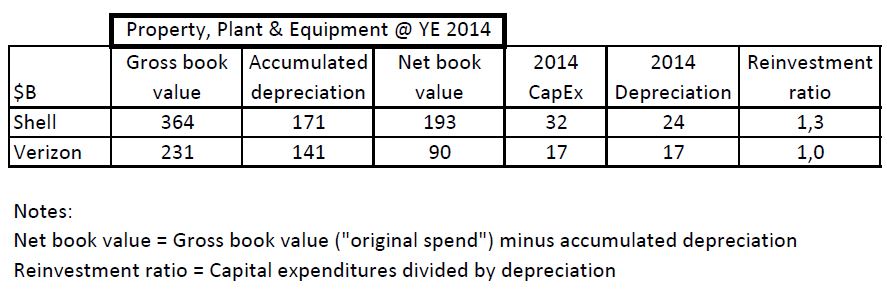
In terms of products and technology, oil and telecom companies are very different: finding, extracting and refining vast amounts of oil products, versus transmitting, securing and storing vast amounts of data. No overlap between these industries at all, at first glance. However, when you review the cash flow statement of companies in these respective industries, you find striking similarities. Let’s take Shell (the British-Dutch oil company) and Verizon (US-based telecom and networks company) as examples. Similar characteristics apply to their industry peers like BP and AT&T.
Both Shell and Verizon are very capital-intensive companies. They have huge amounts of fixed assets (property, plant and equipment) on their balance sheet: Shell at $193B net book value per year-end 2014, and Verizon at $90B. To add to that, both companies have significant capital expenditures (CapEx, fixed asset investments during the year), which is a huge cash outflow every year. For Shell $32B of capital expenditures in 2014, and Verizon $17B.
Both Shell and Verizon are very well known and respected as high dividend yield companies. They have a reputation for being highly dependable for paying quarterly dividends in cash to their shareholders, which appeals to large groups of investors, versus a share price that is fairly stable with few variations and hardly ever any dramatic surprises (positive, or negative). The very large dividend payments of $9B for Shell in 2014 and $5B for Verizon (and occasional share repurchases in times of excess cash) create a very significant annual cash outflow.
Where do these companies get the cash inflow to finance the capital expenditures cash outflow and the dividend cash outflow? Until recently, both Shell and Verizon were blessed with a very healthy inflow of cash from operating activities of $45B and $31B respectively (roughly: customers paying the company, minus what the company pays in salaries to employees, invoices to suppliers and taxes to the government), which easily covered the cash from investing and cash from financing activities outflow.
All was well in the oil industry until 2015. Then, oil prices continued to drop dramatically (from an average of $100 per barrel in 2014 to $55 in the first months of 2015), which hurts the operational cash flow at oil companies hard. In Shell’s case, every change of $10 in the oil price impacts cash flow by $3.3B.
All was well in the telecom and network industry until 2015. Then, the auction of spectrum licenses in the US (enabling the next generation of wireless technology) turned out to be a very competitive event, with AT&T spending $18B and Verizon $10B. Not everyday expenses, and not an amount of cash that even a large and cash rich company like Verizon has lying around (well, unless you want to completely deplete your cash balances, which is not advisable as you have no money left for business continuity, i.e. to pay your employees and suppliers, and continue your investments).
So how have Shell and Verizon “solved” their cash flow problem in 2015? Neither company wanted to cut its dividends (cash payments to shareholders), as this would hurt its reputation as a predictable and dependable dividend paying stock. Neither company wanted to significantly restrict its spending on capital expenditures, as investing less now would hurt its ability to compete in the future. Shell has significant borrowing capacity and a AA/Aa1 rating, and can easily borrow an incremental ten billion GBP at very favorable interest rates (which it has done), while Verizon is fairly “maxed out” on borrowing (with a BBB+ rating) after its purchase of the Vodafone share in its wireless business in 2014 (raising $49 Billion in the largest corporate-bond sale ever, as one of the ways to finance the $130B deal). Both Shell and Verizon are selling off non-core assets, in the case of Verizon $15B in two major transactions in early 2015.
In every company around the world, the cash needs to flow. Without cash, it’s game over, and as existentialist philosophers have correctly remarked “existence precedes essence”. What can we learn from the oil and telecom industries? In industries where companies need to continue to invest very significantly every year in order to build capacity and/or a technological competitive advantage, and investors are conditioned to expect large stable dividend payments, you need to generate incoming cash flow to keep operating. You can either borrow more (to a limited extent) to finance your business, sell assets (to a limited extent) to free up cash, or most importantly maximize the operational cash flow by improving profitability, and managing working capital (receivables, inventory, payables) carefully. If you want to know which decisions a company is making, what the sources and uses of its cash are, then watch its cash flow statement carefully. It is vastly underrated versus its more popular next of kin, the income statement.
Ancient business wisdom says “What gets measured gets done”. Business leaders and financial executives have used this heuristic to design and implement key performance indicators that link to the company’s strategy. A related rule of thumb is that it’s only fair to measure people on things they can influence.
But does and should the opposite also apply? “What does not get measured, does not get done”? Logically speaking, maybe that should be the case, and many employees seem to implicitly use this statement to justify not taking certain actions (“if it is not measured, then it doesn’t help me on my performance review, or get me a bigger bonus, and it isn’t worth doing”). However, this assumes that the key performance indicators have been correctly chosen by the company, are fair indicators of the company’s success, and that everything that is truly important can be (numerically) measured.
In my view, we should look to moral philosophy for guidance, rather than business literature. Jeremy Bentham and John Stuart Mill held the view that “the moral worth of an action is determined by its outcome” (utilitarianism, consequentialism). Immanuel Kant disliked this utilitarian approach, as good consequences could arise by accident from an action that was motivated by a desire to cause harm to an innocent person, and bad consequences could arise from an action that was well-motivated. Instead, Kant proposes to focus on principles: “There are principles that are intrinsically valid; they are good in and of themselves; they must be obeyed in all, and by all, situations and circumstances”.
Based on Kant’s principle-based ethics, I would reject the “What does not get measured, does not get done” viewpoint. Some fundamental principles of doing the right things (leadership), doing things right (execution excellence) and doing right (integrity), cannot necessarily be fully measured by key performance indicators in a utilitarian way. There’s definitely a context to what we do in business….
Culture matters. A lot. Our cultural background shapes the way we view the world, what we find “normal” or “strange”. Cultural biases are very strong in human beings, though they can be overcome by awareness and appreciation of other cultures, through travel and exposure to alternative ways of viewing the world.
Culture even plays a very big role in the financial reporting of companies. And not just in the “technical”/numerical sections, where how we keep the score is influenced by the rules and principles we apply to the calculation (US GAAP used in the US, IFRS used in 120+ countries globally, or “local GAAP”). Each of these accounting frameworks for reporting to the stock market has its own definitions and calculations of metrics such as “profit”. These might be similar in many cases, but are not fully identical.
Culture is much more evident in the “branding” and contextual sections of the annual report, such as the title that is chosen for an annual report, or the messages from the senior leadership in the “letter to the shareholders”.
Both in my years as an employee, as well as in those as a trainer and external consultant, I have mostly worked for global companies with American roots. I like the optimism, forward-looking orientation, and passion to “dream big” that is embedded in American culture. It shines through in the annual report: much of what the CEO is sharing (in the letter to the shareholders) is about the initiatives the company is implementing, the market opportunities it is pursuing, and the great future that is ahead of us. Some time is spent on recent results, but looking back at last year is mostly done in the “Management’s Discussion and Analysis (MD&A)” section, which is much further down the annual report (the smaller font “technical” section that fewer readers get to).
If we then turn to the annual report of a British company, we will find a Chairman’s Review and a Chief Excecutive’s Review (reflecting the two-tier structure in the UK, versus the Chairman-CEO single point of power in the US) that largely deal with last year’s performance, with possibly a little reference to what this means for the future of the company. The tone of these is much more modest, at times even apologetic, versus their more optimistic or even aggressive US counterparts.
The most overly optimistic annual report title (versus the actual financial results) I have ever seen was in the midst of the financial crisis, in the Caterpillar 2009 annual report: the title “How we win” suggests that the company has done very well, while the financial overview shows a 37% drop in revenues versus the prior year, and a whopping 75% (!) drop in profitability versus prior year. Caterpillar is a global company with clear American roots. Worth going beyond the cover page and the impressive marketing/branding efforts on people and products, to get a more holistic view once you go through the key financials (revenue, operating margin, cash flow from operating activities).
It’s worthwhile to review a company’s annual report, as a shareholder, employee, customer, or supplier. But before you dive in, ask yourself what the context is of the (narrative or financial) messages you are looking at!
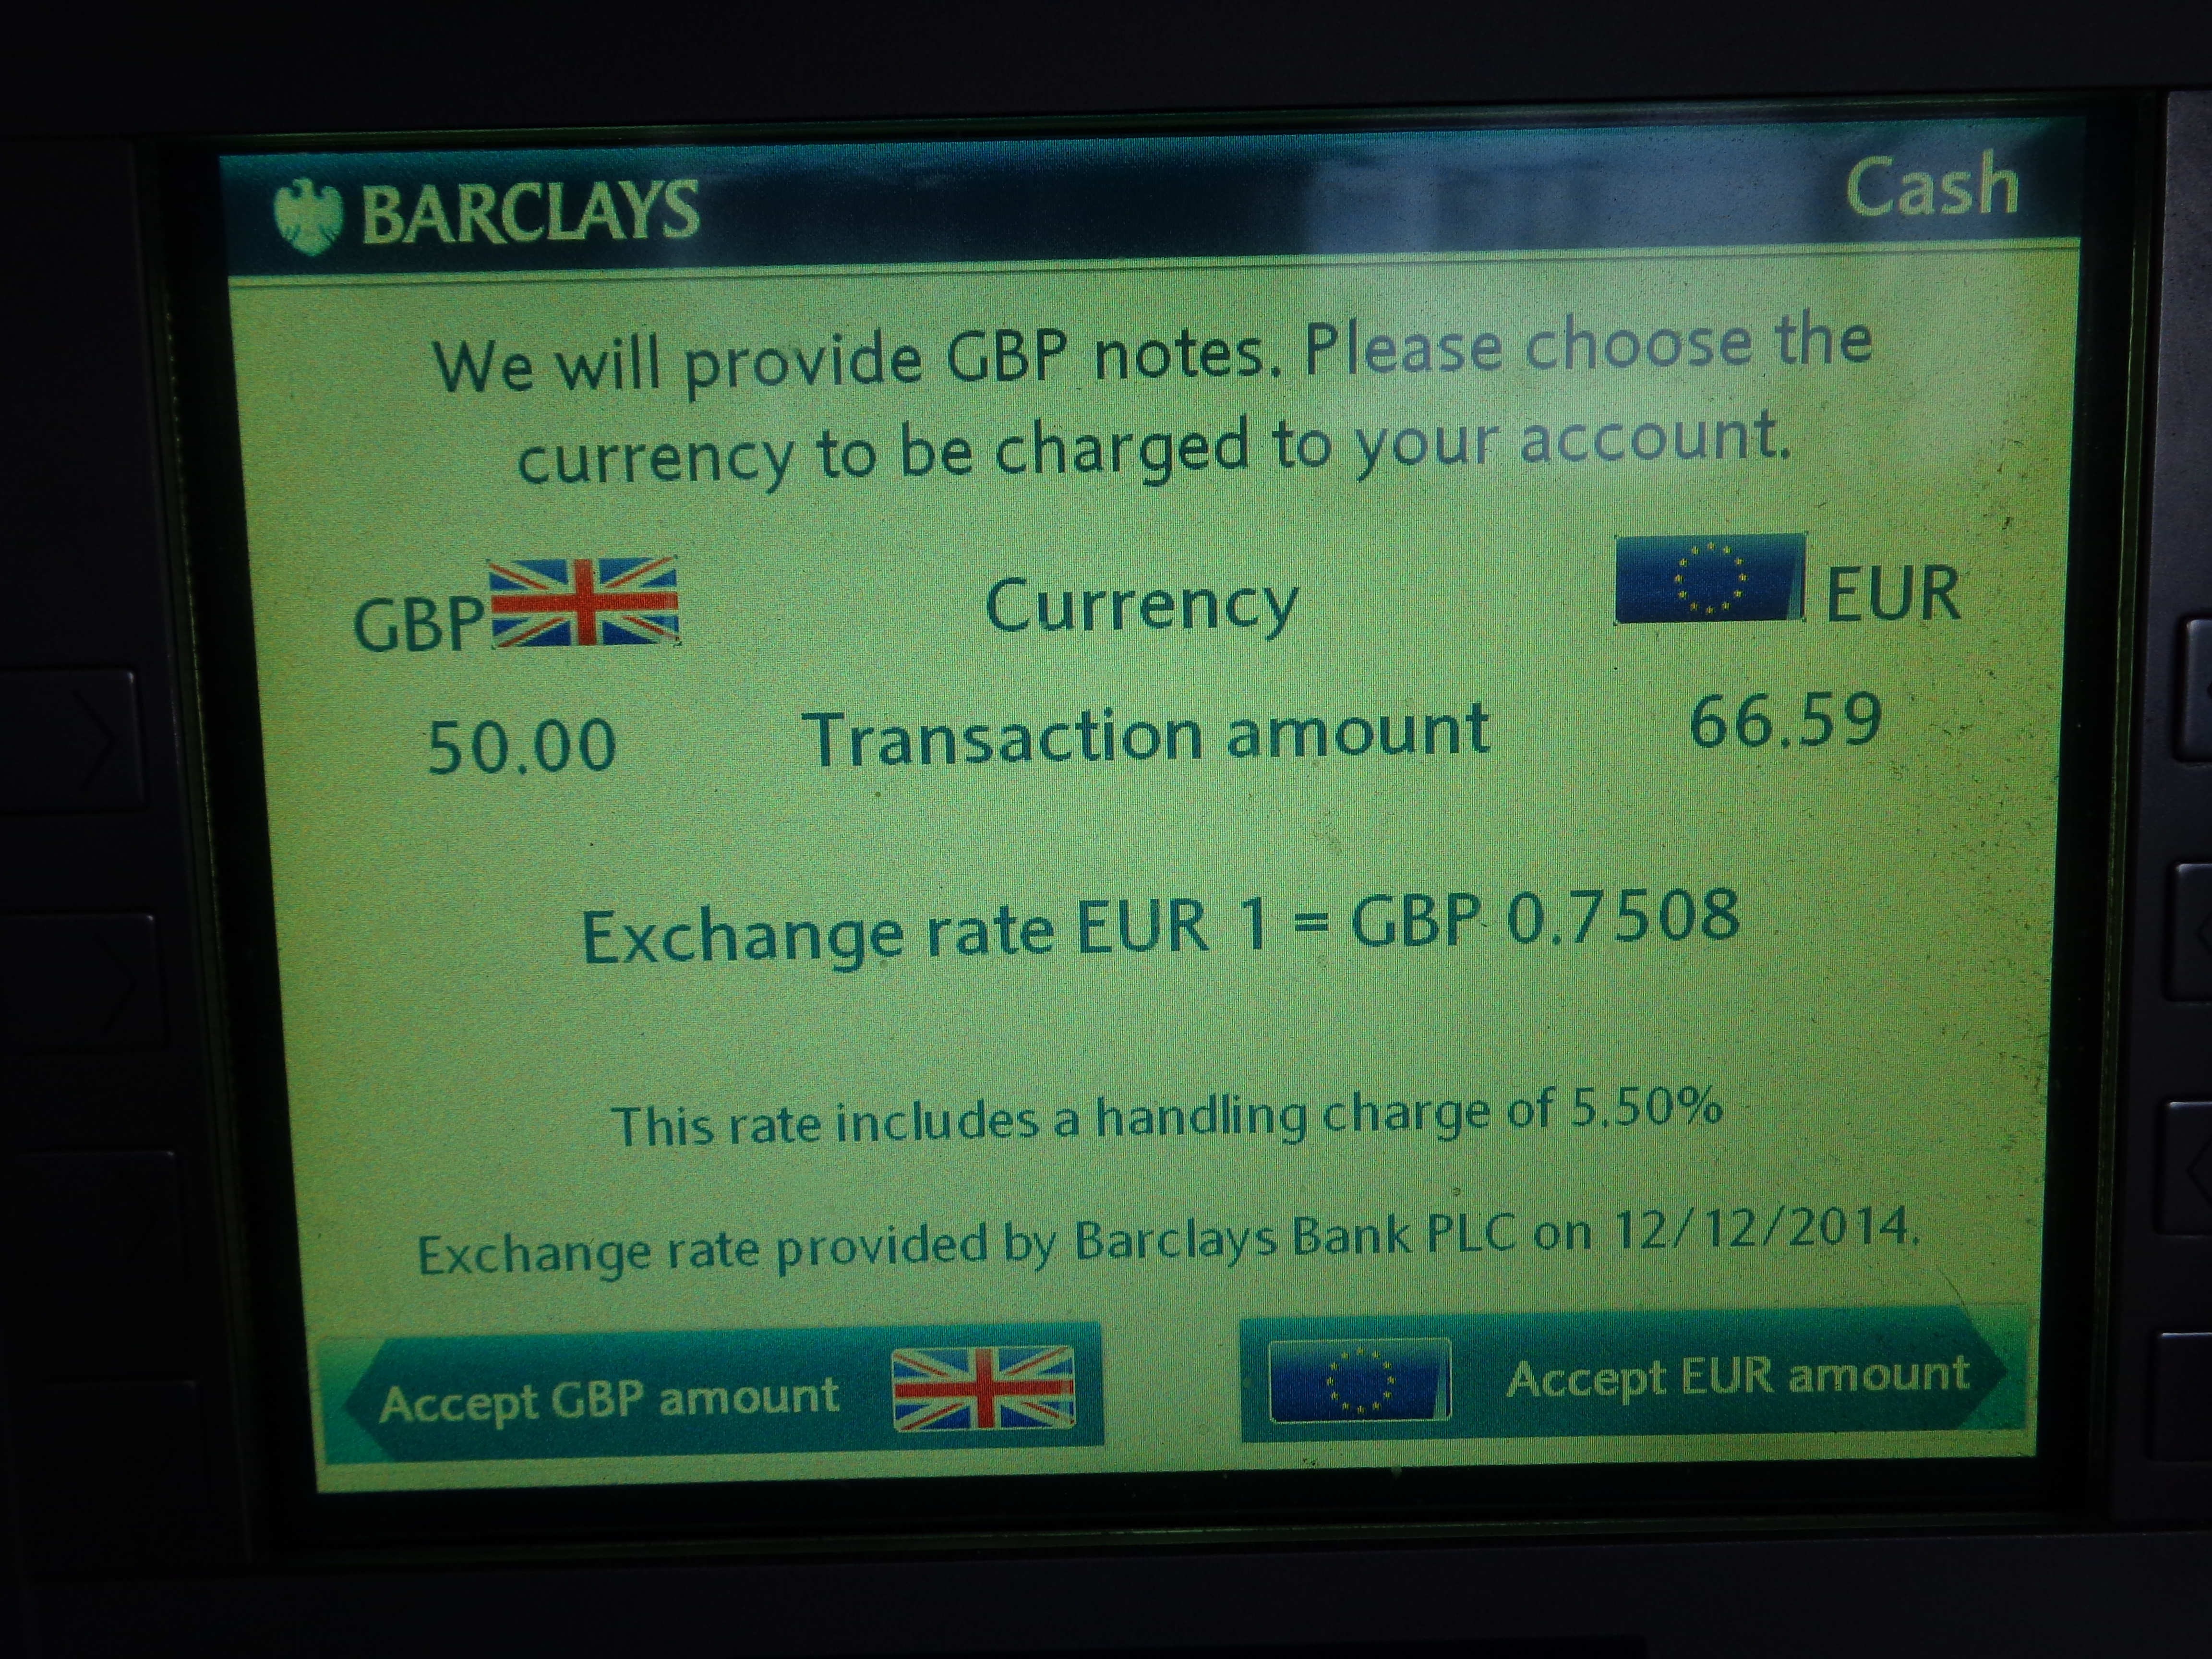
“We will provide GBP notes. Please choose the currency to be charged to your account.” This question (or a variation on the theme) is asked time and again to travelers like myself that withdraw cash from an ATM abroad. So what do you choose? The button on the left in the screenprint below, which leads you to be charged by the foreign bank in the foreign currency of the country you traveled to (and then have your home country bank convert it to your home currency), or the button on the right which will have the foreign bank convert to your home currency directly? Yes, please read that question again, as it takes a significant amount of brain energy to think through, especially if you are tired from travel and jetlag.
Well, says the average traveler, in the end the ATM withdrawal will have to be charged in my home currency to my bank account anyway, so I might as well have it done right now by this friendly foreign bank, go for the easy road of convenience and get it over with, choose the familiarity of a currency that I know rather than a currency I don’t know so well, so let me press the “Please convert” button on the right. Many foreign banks nudge you strongly towards this option by using words like “guaranteed rate” to instill a sense of safety and comfort.
The startling reality is that having the foreign bank convert the currency for you (the button on the right) is the far more expensive option! And I am trying to figure out which “service” these foreign banks are trying to convince me they should be charging me for. A basic economic premise is that the higher the value you provide, the higher the fee or price you can charge to your customer. However, if you do not provide value to me, then I do not pay you. The foreign bank (in the case of this example Barclays UK) is pretending to sell you “security, comfort, and risk management”, when all they really do is charge you a handling fee for currency conversion which you can easily avoid by having your home country bank (in this case ING NL) do the conversion for you for free at a more favorable rate. At least Barclays discloses their conversion surcharge in a reasonably sized font, so if you bothered to think it through you could figure out what this would cost you. A less respectable Hungarian bank recently made me an offer of 280 HUF to 1 EUR “pre-converted”, while I knew the actual exchange rate was a much more favorable 305 HUF to 1 EUR at my home country bank, so I happily declined. As you cannot assume that the average traveler knows these rates by heart, I am of the opinion that a bank should clearly spell out what the ATM user’s options are, and what they will cost him. Or even better, not even complicate things by offering the “pre-conversion” option, but instead plainly stating that the foreign bank charges the exact amount of foreign currency withdrawn to the home country bank who will then proceed to do the conversion at spot rates.

You could argue that withdrawing cash from an ATM is terribly old-fashioned, and you should pay electronically whenever and wherever you can. Unfortunately, the same FX scam applies to electronic transactions as well, in an even more blatant form. I visited Turkey recently, where upon checking out from the supposedly respectable Hilton hotel, I chose to pay by creditcard. The receptionist handed me the terminal in order to input my security code, and without even asking me had preselected the option without my consent to have Garanti bank convert the Turkish Lira amount to US dollars (why would I ever want that when my base currency is Euro?) at a 3% markup. I assume Garanti somehow shares this commission with Hilton, to align the incentives (against the customer). My home country bank then had to convert these US dollars to my home currency of Euro. Direct conversion from Turkish Lira to Euro by my home country bank would have saved me €16. Sure, losing €16 will not bankrupt me, but I’d rather spend it on a cup of tea and some chocolate.
It saddens me that banks try to make money off transactions where no real value is provided to the customer. I had hoped that their ethical standards and commitment to transparency would have improved after all the scandals in the past decade. Yes, it is only a relatively small amount per customer, but this scam does add up with a high transaction volume.
So, next time you’re in front of an ATM abroad, press the “Decline” option when they make you an offer to “pre-convert”.
While other airlines only send lame e-mails with offers to book a car or hotel connected to your flight, Etihad has a more exciting question: would you like to bid for an upgrade to business class? If you bought an economy class ticket, Etihad will “auction” upgrades to business class for each leg of your journey. The process is in three easy steps: make an offer using a slider that indicates the offer strength, enter credit card details, review and submit. The airline will then notify you via e-mail if the upgrade request has been approved (and only then charge you).

Easy to use, and I would gladly participate if I could make a token low bid of let’s say €100 or €200 with a 10% or 20% probability that I would be lucky enough to get a seat. In other words, a “small investment, huge pay-off” bet. An offer strength indicator indicates the range of past successful offers for similar flights. Unfortunately, in my case, the slider tool does not allow a bid below €560 per leg, which would get me into the “red” category (this translates to me as: unlikely to be accepted). Starting at €595, you get into the “yellow” category (suggesting you have some chance of acceptance), and starting at €765 you are in solid dark “green” (suggesting it is highly likely that the bid will be accepted).
Frequent travelers have posted tips for successful bidding on the internet, such as:
- Look at what it would cost you to purchase the business class fare
- Bid slightly over the minimum bid
- Check how full the flight is. Make a pretend booking online, in both business and economy, so you can get to see the seat map for each cabin. If business class if empty your chances of an upgrade are good. If economy class is super full, your chances of an upgrade are quite good as airlines overbook flights all the time so freeing up your economy class seat could help.
- Decide what the upgrade is worth to you.
- The kind of ticket you purchase may matter.
- Your frequent flyer status with the airline may count.
Given that my original economy ticket was €988 roundtrip, I am not feeling I get a good “deal” here, as an economy ticket plus two upgrade bids would not be significantly cheaper than booking a business class ticket from the start.
In short: I love the concept, a nice incremental business model that could generate a good amount of additional revenue for Etihad by getting already “captive” economy passengers into those empty business class seats, but the deal has to make the customer feel he “wins” as well versus walking up to the ticket desk at the airport and buying an upgrade there.
Categories
Factually correct, contextually lacking
I often contemplate the nature of reality. Even, or maybe especially, when I review a company’s public proclamations about its financial performance. What is fact and what is fiction? Is somebody trying to put a “spin” on the story? “Objects in the rear view mirror are closer than they appear”….
Fair and accurate representation
When reading earnings releases and annual reports, it is important to realize that companies are required under accounting regulations (and are hopefully intrinsically/ethically driven) to provide financial statements that are a “fair and accurate representation” of the company’s financial position, results of operations and cash flows. These financial statements inherently include “some amounts that are based on management’s best estimates and judgments”. Finance is more an art than a science. Companies that are “listed” (their equity or debt is tradable on stock exchanges), use either US GAAP or IFRS (depending on where they are listed (US or Rest-Of-the-World)) to guide their (subjective) interpretation of the complex operational reality.
So far, so good. Financial statements are put together using judgments and subjectivity. That’s not necessarily the area where I have surreal experiences when trying to inform myself about a company’s success (or lack of it) through studying its earnings releases and annual reports. I get very cautious, as well as excited to uncover the underlying data and “truth”, when I get to those parts of the information where a “spin” is put on the facts: sections such as the “letter to the shareholders”, the 1-page graphical summary showing 5 to 7 key indicators, or the PowerPoint slides provided with the earnings call. Let me discuss several areas where “reader beware” applies. Disclaimer: I am not “accusing” any of these companies of misstatements or of misinforming shareholders, just pointing out that there are cases where information is provided that might be factually correct, but where shareholders that fail to inform themselves about the broader context of these facts might draw the wrong conclusions.
Beware of the time horizon
GE is a great company to study and follow. Always executing multiple big strategic initiatives at the same time, and transforming the business portfolio by making bold moves. The earnings releases and investor outlook meetings are significant events in my calendar. You do however need lots of background knowledge about the company to properly judge some of the statements made.
GE example #1 is the 2Q 2011 earnings release comment on the execution of the capital allocation plan, with a factually true claim of having announced a “third dividend increase, up 50% since 2Q 2010”. Mathematically, this is completely correct: on July 23, 2010 the first increase (from $0.10 to $0.12 per quarter) was announced, then on December 10, 2010, the second one (from $0.12 to $0.14), and on April 21, 2011, the third one (from $0.14 to $0.15). However, this statement omits the 68% dividend cut announced in February 2009, from $0.31 per quarter to $0.10 per quarter. So yes, a multi-step dividend increase from $0.10 to $0.15 does equal a 50% improvement, but it is at the same time still down more than 50% from the “pre-cut” levels. In late 2014, the dividend is at $0.22 per quarter, a further increase versus the lowest point in 2009, but still not back at 2005 to 2009 levels.
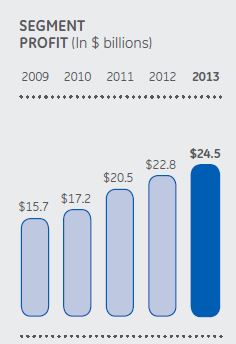
GE example #2 is the segment profit graph from the 2013 annual report. It covers the 2009-2013 timeframe, and shows an impressive increase of $8.8B or 56% from $15.7B (2009) to $24.5B (2013). The graph omits the detailed split between the key segments, which would have shown you that the industrial businesses “only” went up by $1.8B over these years, while most of the increase comes from GE Capital going from marginal profitability in 2009 of $1.4B to much healthier profitability levels in 2013 of $8.3B. A key data point to know for investors, which is not provided in the graph of page 1, but in the summary of operating segments on page 42. Furthermore, the graph uses the common 5-year comparison, whereas a broader 7-year comparison would have told you that segment profit was a stunning $25.6B in 2007. In other words: yes, GE has shown significant profitability improvement in the 2009-2013 timeframe, but its profitability in 2013 is not yet back at pre-crisis 2007 levels.

GE example #3 is the 5-year revenue graph from the 2013 annual report. It shows GE’s revenue shrinking from $154B in 2009 to $146B in 2013, and suggests that this is largely due to having NBCU as a fully owned subsidiary in the past (contributing $15B revenue in 2009) to a minority shareholding and subsequent full sale to Comcast (contributing a final $2B in revenue in 2013, i.e. a drop of $13B over the 5-year period), plus the deliberate shrinking of the GE Capital business portfolio (causing a $7B drop in revenue). These statements are factually true, but firstly omit the context of the 7-year overview where GE historically had a much higher 2008 revenue of $180B (!) including NBCU, and $163B excluding NBCU. Secondly, the incremental revenue impact of acquisitions like Converteam, Dresser, Wood Group Well Support, Wellstream, Clarient, Lufkin and Avio is not mentioned or split out. If you split out the revenue impact of a significant divestment like NBCU, shouldn’t you split out the positive revenue impact of the acquisitions in the same graph?
Beware of “non-GAAP” supplemental information
Companies in the healthcare sector tend to be highly profitable in most years (EBIT margins in the 15-20% range), but have very volatile earnings. Many of these companies provide “non-GAAP” supplemental information, stating that the alternate figure more accurately reflects their company’s performance. In most cases, this means isolating “unusuals” or “special items” from the performance: common examples are litigation charges and settlements, product recalls, restructuring costs, acquisition-related charges. The non-GAAP (“after clean-up”) profit in almost all cases is higher than the GAAP profit (what the official accounting rules tell you to report).
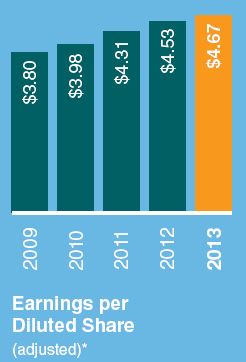
Baxter provides a graph every year of “Earnings per Diluted Share (adjusted)*”, a nice smooth graph of steadily increasing EPS. Earnings per Share is a fairly straightforward metric: total net income divided by the number of outstanding shares. Repurchasing of shares by a company can have a huge effect, as it decreases the denominator in the equation. In Baxter’s case, the adjustment of the numerator (earnings, or net income) has a much bigger effect. In 2010, the net income was $1.4B, while the non-GAAP profit (excluding special charges) was $2.4B, a difference of $1B. Strangely enough, this huge difference is not explained in any detail in the annual report, but there is some small print explaining the “*” mark: “Please see the company’s website at www.baxter.com for a reconciliation to earnings per diluted share.” My personal opinion in this is that companies should make these adjustments (on a line item basis) an integral and upfront part of their financial reporting.
A review of other companies (J&J, Abbott, Hospira, BD) in the healthcare sector showed that the significant size and number of non-GAAP items is common practice in this industry’s financial reporting. Hospira even turned a 2013 GAAP loss of $8MM into a $348MM non-GAAP profit by adjusting for 9 different special items.
Beware of euphemisms
The letter to the shareholders is a useful document to read, it informs you of the company’s strategy, accomplishments, and performance. Be careful with the wording, as euphemisms are sometimes used that should trigger a desire in the reader to dig more deeply into the actual financial performance. Just like the phrase “Mr X is pursuing opportunities outside the company” is often a nice way to say Mr X was fired, companies can use sentences like “….. created significant headwinds for the company. Despite these challenges, the company also enjoyed many accomplishments” to talk “around” the problem. This is the time to pause and dig into exactly what the size and impact was of those headwinds, and whether these headwinds were one-off or will continue to have an impact in the future, before turning to the accomplishments that are likely to be of a significantly smaller size.
“Objects in the rear view mirror are closer than they appear”
Annual reports and quarterly earnings releases should not just be legalistic documents that are mechanically filled in, with templates copied from the previous period where only the numbers updated. Any company should provide an accurate and full representation of the strategic, financial and business risk situation, both in letter as well as in spirit. Drawing selective attention to some items rather than others is not quite the same as lying, but I would not call it fully transparent either.
Categories
Service as the key to success
Razor and blades (Gilette, Wilkinson). Printer and toner (HP). Instrument and consumables (Applied Biosystems). Aircraft engines and service (GE, Rolls-Royce). Smartphone and data usage / call minutes (Verizon, Vodafone). Each of these is an example of a business where building an installed base is key, as the subsequent service revenue (in the broad sense of the word) is both lengthy in duration as well as highly profitable. Some companies make significant business concessions in pricing of the former (the “equipment”) to get access to the latter (the “service”). It might even be a rational economic decision to sell the equipment at a loss, provided the service revenue and profit stream is captive and customers cannot easily switch to other service providers. Alternatively, a structure where a customer gets a longer term free-of-charge use of a piece of “demo equipment”, but pays for the consumables, could make sense.

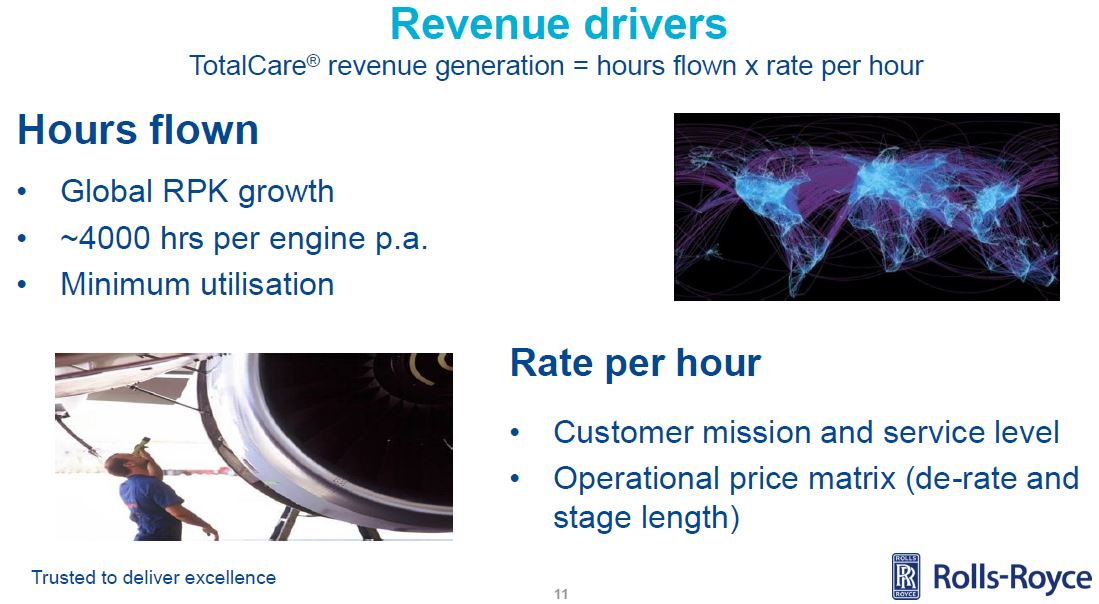
Rolls-Royce provided a nice rule-of-thumb chart in its very informative investor briefing in June 2014: services revenue is at least 4 times net OE selling price over the lifecycle of an engine program. GE at the end of Q3 ’14 had a total backlog (orders committed, but not yet delivered) of $250B (!), of which $180B in services and $70B in equipment. Half of GE’s backlog is in the Aviation business. GE implicitly provided Operating Margin (EBIT) percentages (see my article on GE’s service versus equipment margins) for each type of business: equipment at around 10% OM, service at 30% (disclaimer: across GE’s broad industrial portfolio, not specifically for aircraft engines). Service proves to be an attractive revenue and profit generator for both these companies.
Which indicators should we track to measure the service business’ earnings potential?
It’s important to have estimates of how the installed base of a company’s equipment placed with customers will develop. The potential for service revenue then depends on the usage of the equipment and the contractual structure of the service agreement. In the aviation business, billing for engine service contracts tends to be based on hours flown times rate per hour. Therefore, RPK (Revenue Passenger Kilometers) or RPM (Revenue Passenger Miles) are key indicators for companies like Rolls-Royce and GE, and often mentioned on the first page of investor briefings and earnings releases. If RPK/RPM goes up or down, it has a significant impact on the most profitable part of their business!
Categories
The beauty of the British Pound
A short reflection on the beauty of the British Pound.
Well, not really on the currency itself: I used to encourage the Brits to actually give up the British Pound and join the Euro, as their economy is closely interrelated with that of the rest of Europe and a joint currency might facilitate trade, but after studying the great works of Nassim Taleb (“The Black Swan”, “Antifragile”) I have become more skeptical about fragile complex systems we do not understand (like the Euro) that might have many unwanted side effects. So let me proclaim myself to be an agnostic on the question whether the Brits should continue to use the British Pound.

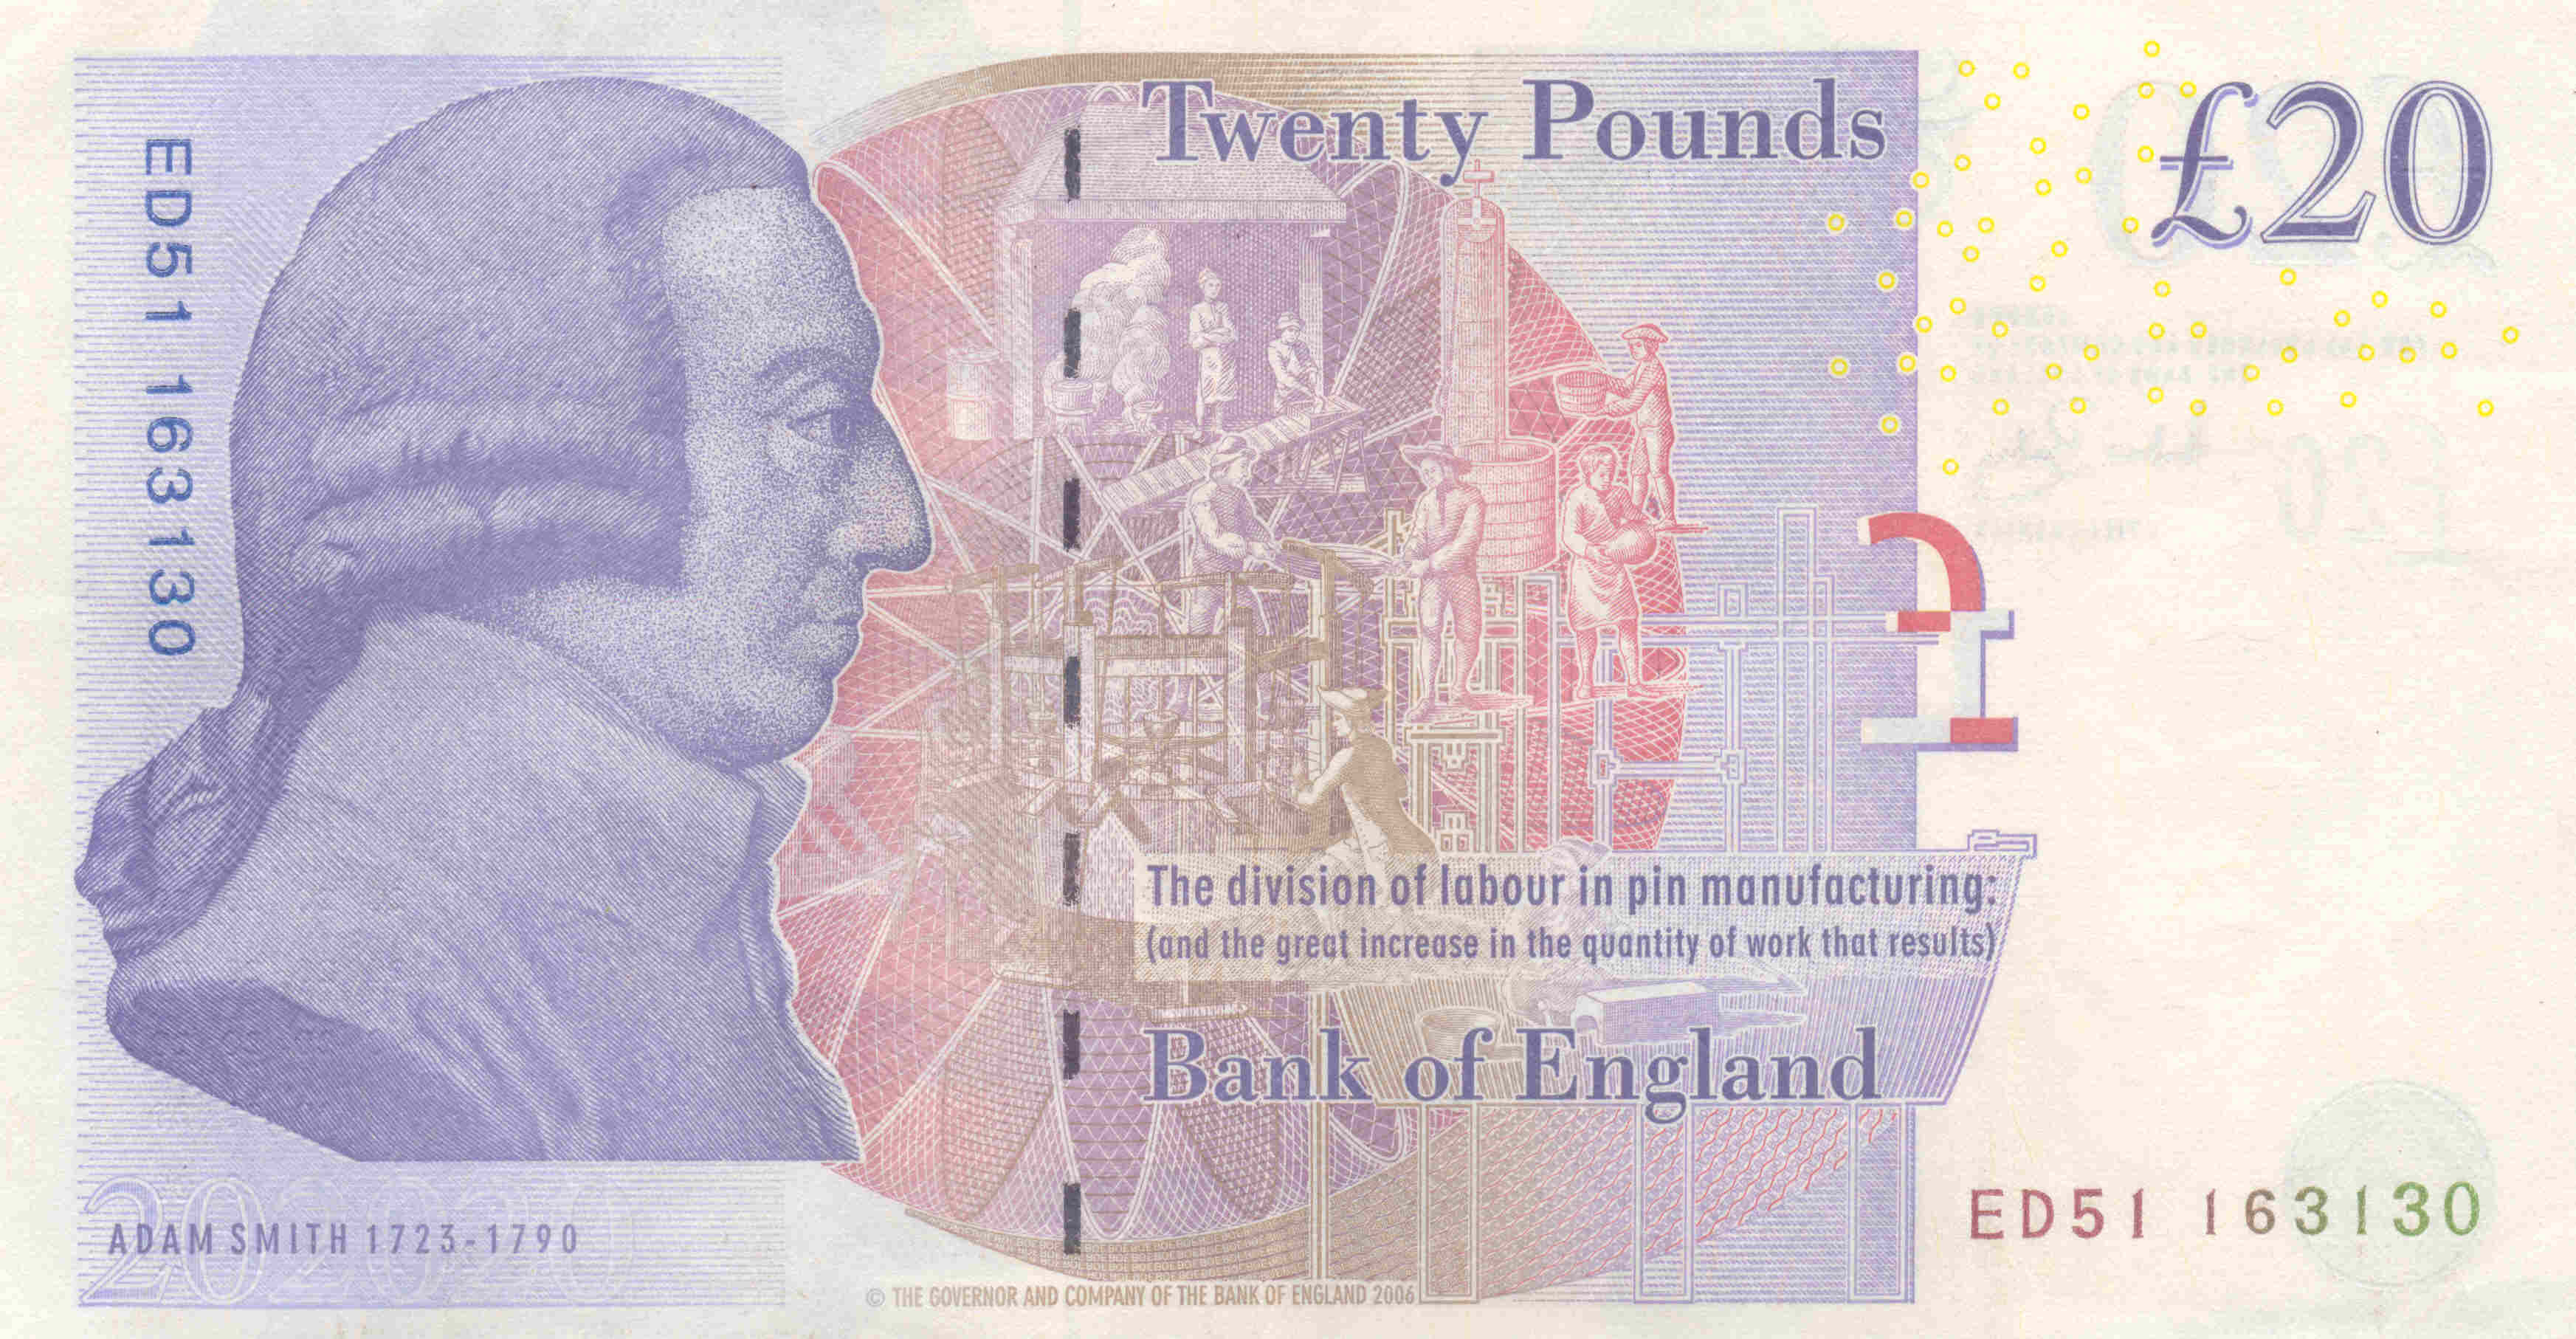
Rather, I would like to reflect in this article on the beauty of the British Pound banknotes, in particular the back side of them. Each is graced with a portrait of a great British scholar: the £10 note with Charles Darwin (1809-1882), and the £20 note with Adam Smith (1723-1790). I am disappointed that Smith got to be on the £20 note and Darwin “only” got the £10 note, as I deem the scientific impact and reach of Darwin’s ideas far more noteworthy than those of Smith (even though I studied economics myself, rather than biology). Not only does Adam Smith get to be on a note of higher nominal value, there are also many more £20 notes (1.8 billion) than £10 notes (700 million) in circulation. So who wins the popularity contest? I think neither of them would have cared, if they were still alive. The amusing thing is that Adam Smith was a Scottish economist, the first Scot to appear on an English note.
The beauty of having these two scholars on the British Pound notes is that they teach us a similar concept: Darwin’s discovery of the mechanisms underlying evolution, and Smith’s discovery of the mechanisms of wealth creation. To simplify and summarize matters greatly: one of Darwin’s key propositions is that those organisms that are best adapted to their environment have greater chances of survival, one of Smith’s is that division of labour in manufacturing causes a great increase in the quantity of work that results. In short: adaptation and specialization, concepts that have significant applicability in the area of business strategy, as well as career planning. Are you (and/or your company) working on those things that you are technically competent at, that you enjoy doing, and that pay reasonably well? If so, your earnings potential, your job satisfaction, and “chances of survival” (in a dynamic and turbulent economy, with lots of companies going bankrupt, and jobs under threat of restructuring) are likely to be higher. Those are the questions that I contemplate every time I have British Pound banknotes in my hands. Good triggers for reflection. I am lucky to visit the UK on a regular basis, and use its analogue currency whenever I can. Adam Smith will be around on the £20 note for many more years, as “his” £20 note was issued in 2007 as part of “Series F”. Charles Darwin will sadly be replaced by Jane Austen in 2017 on the £10 note, but has had a long run in circulation since 2000.