I love making my Finance Storyteller YouTube video content on finance, accounting and business topics that are of interest to people. It’s amazing how some topics can far exceed expectations in terms of the number of views and comments, like this video on the financial term “Equity”! Enjoy watching!
Category: Finance
I am sharing samples of my work: stories I tell during the training courses I deliver. This blog also serves as a “further reading” opportunity for participants. The “Finance” section is all around financial analysis: margins, cash flow, how to read annual reports and earnings releases.
Categories
How to learn finance?
Categories
Most popular Finance Storyteller video
Categories
Financial ratios explained
Categories
New Finance Storyteller videos
I have been adding a lot of new videos to my Finance Storyteller YouTube channel over the past months, up to a total of 44 now on a wide variety of topics. One of these recent videos, on the very useful analytical tool called DuPont analysis, has been doing particularly well in terms of number of views, and ranking in search results. Enjoy!
I have seen a lot of companies where the CFO has trouble getting his or her C-level peers, let alone employees in general, focused on the big metrics that really matter. Here’s a video that could help communicate to both your finance team and non-finance colleagues what Free Cash Flow is, and how to impact it.
EBIT and EBITDA are probably terms that you company’s CEO and CFO use often, and expect you to understand as well. Would you like to know what EBIT and EBITDA mean, and while doing so get a quick refresher on what’s in the financial statements, what an income statement looks like from “top line” to “bottom line”, and what depreciation means? All of these are included in this short 6-minute video! Enjoy!
The registration date for the GE-Synchrony exchange offer is fast approaching, as the deadline is November 16. At first sight, it looks like a one-time 7.5% “free lunch” return is available to the agile investor. However, this begs the question whether “free lunches” exist, or whether every expected return is matched to its risk level instead. I tend to favor the latter view on the world. In this blog posting, I am sharing my personal considerations as a small private investor. I am in no way providing investment advice, but can hopefully clarify which key items you should consider when evaluating the offer.
2015 is proving to be an exciting year for GE: receiving regulatory approval for the acquisition of Alstom’s Power and Grid business, announcing and making significant progress in selling most of GE Capital in order to become “a new kind of industrial company”, a sizeable investment by activist shareholder Trian (of disruptive DuPont fame) in GE shares, and solid financial results quarter after quarter. Year-to-date Nov 6 2015, the share price is up 18% (all of which actually materialized since late September), so shareholders are seeing some positive returns due to the heightened attractiveness of the company and the improving prospects for its future.
All of these were fairly passive events for the average shareholder. But now GE gives shareholders something to choose, with the announcement of the GE – Synchrony Financial exchange offer. Basically, the question is: would you like to swap some or all of your GE shares for shares of Synchrony Financial? For each $100 of GE common stock accepted in the exchange offer, you will receive approximately $107.53 of Synchrony (SYF) common stock, subject to an upper limit of 1.1308 shares of Synchrony common stock per share of GE common stock.
Here are my suggestions of key items to think about when you evaluate the offer:
- Recent share price development of GE and SYF. GE seems to be getting a lot of favorable press recently, and positive upward share price dynamics might continue. SYF has steadily risen in share price since its introduction on the NYSE, from mid-$20s to mid-$30s. A word of caution: as GE currently owns the vast majority of SYF shares, there is a very limited free float (publicly tradeable shares) for SYF so far, and therefore the swings in share price could be following unusual patters! In order to judge the relative performance of the shares, a comparison to relevant stock index benchmarks would be appropriate (assuming there is such as a things as “meaningful industry peers” for each of these unique companies). To fully consider investor returns, it is also important to take into account the high dividend yield on GE shares (whereas SYF pays no dividend yet), and the risk profile (GE as a diversified company, while SYF has a “single business” focus).
- Future potential for the respective shares. If I had at least a full week available (which I don’t) to construct my own financial models of expected revenue, profit and free cash flow growth for GE and SYF for the next decade(s), based on a thorough analysis of all available company and industry information, I surely would. When looking at the median advice of stock market analysts, both companies seem to have high single-digit to low double-digit share price increase potential, with SYF prospects possibly above those of GE. If the exchange offer gets executed, GE will retire the GE shares offered by shareholders in the exchange, increasing the EPS (Earnings Per Share) growth of the company, and making the GE shares more scarce (relatively speaking, there will still be more than 9 billion of them outstanding), which could increase the GE share price.
- Portfolio considerations: if you did not hold a position in either GE or SYF yet, then would you like to invest in a diversified globally operating industrial company with huge backlog, improving operating margins, and a stable high-margin service business, or a single-play financial institution in the US market (largest provider of private label credit cards in the United States)?
- Recent share split / spin-offs of other companies. I own shares in Dupont (DD), which has been a rollercoaster ride in 2015, up and down between $50 and $70. In its split-off of the former Performance Chemicals division now named Chemours (CC), DuPont common stockholders received one share of common stock of Chemours for every five shares of DuPont common stock. However, the split has not been a happy story: Chemours stock has tanked from $16 down to $7 in the four months since its introduction. I also own shares in healthcare device company Baxter, and have this summer received one share of Baxalta (its former biotech division) for each share of Baxter. The sum of the Baxter and Baxalta share prices has not moved much since the split, providing for (at most) a “neutral” feeling on my side on that spin-off (though that might change if either Baxter or Baxalta comes “in play” as an acquisition target).
- Earlier spin-offs by GE. Genworth (insurance) comes to mind! Introduced to the New York Stock Exchange at $19.50 in 2004, Genworth stock went up all the way to $35 in 2007, but currently trades below $5 (riding the rollercoaster up and down, like so many financial stocks since the start of the financial crisis). GE initially sold 30 percent of life and mortgage insurer Genworth Financial Inc. in May 2004, and subsequently sold the remaining 70% in further increments at higher share prices, making it a successful spin-off when seen from the GE perspective.
- Transaction costs and speculation. If you wanted to benefit from the 7.5% “bonus” in the GE-SYF exchange, you could buy (additional) shares in GE, register them for conversion, then sell the SYF shares, and see whether you made a profit. The potential success of this strategy is obviously very dependent on the transaction costs you incur on the buying and selling, as well as any market positions that (other) speculators may have taken on GE and SYF shares. If there is a massive sell-off of SYF shares after the conversion, and a subsequent drop in the share price, the 7.5% “bonus” might quickly evaporate.
- Abundant liquidity. In the current economy, where central banks continue to increase the money supply and keep interest rates low, investors have plenty of liquidity available and look for opportunities to invest and make a solid return. The sale of various parts of GE Capital has progressed ahead of plan in terms of timing, this could be an indication that SYF might also be an attractive investment opportunity.
- Endowment effect and inertia. How many investors are going to make the effort to read the exchange offer documents, and/or take the step to actually register their GE shares for conversion? How many have an “emotional attachment” to their GE shares, and no “feelings” yet for SYF shares? Psychology and behavioral economics studies have shown that the default choice for many people in complex situations is to stay with what they know or have, rather than venture into the unknown. Based on that, the number of shares that will be registered for the offer may be low.
- Risk factors, including but not limited to:
- One of the many clauses in the exchange offer, is that GE is not required to complete the exchange offer unless at least 634,743,750 shares of Synchrony common stock will be distributed in exchange for shares of GE common stock that are tendered in the exchange offer. In total, 705,270,833 shares of SYF are made available by GE in the exchange, so the offer has to be nearly fully subscribed for GE to execute it.
- If the upper limit is in effect, you will receive less than $107.53 of Synchrony common stock for each $100 of GE common stock that you tender based on the Average GE Price and Average Synchrony Price, and you could receive much less.
- GE may have to limit the number of shares of GE common stock that it accepts in the exchange offer through a proration process.
In summary….. As the prospectus says: “Whether you should participate in the exchange offer depends on many factors. You should examine carefully your specific financial position, plans and needs before you decide whether to participate, as well as the relative risks associated with an investment in GE and Synchrony…… You must make your own decision after carefully reading this prospectus, and the documents incorporated by reference, and consulting with your advisors in light of your own particular circumstances. You are strongly encouraged to read this prospectus in its entirety, including any documents referred to or incorporated by reference herein, very carefully.” I fully agree! It seems that every expected return is matched to its risk level after all!
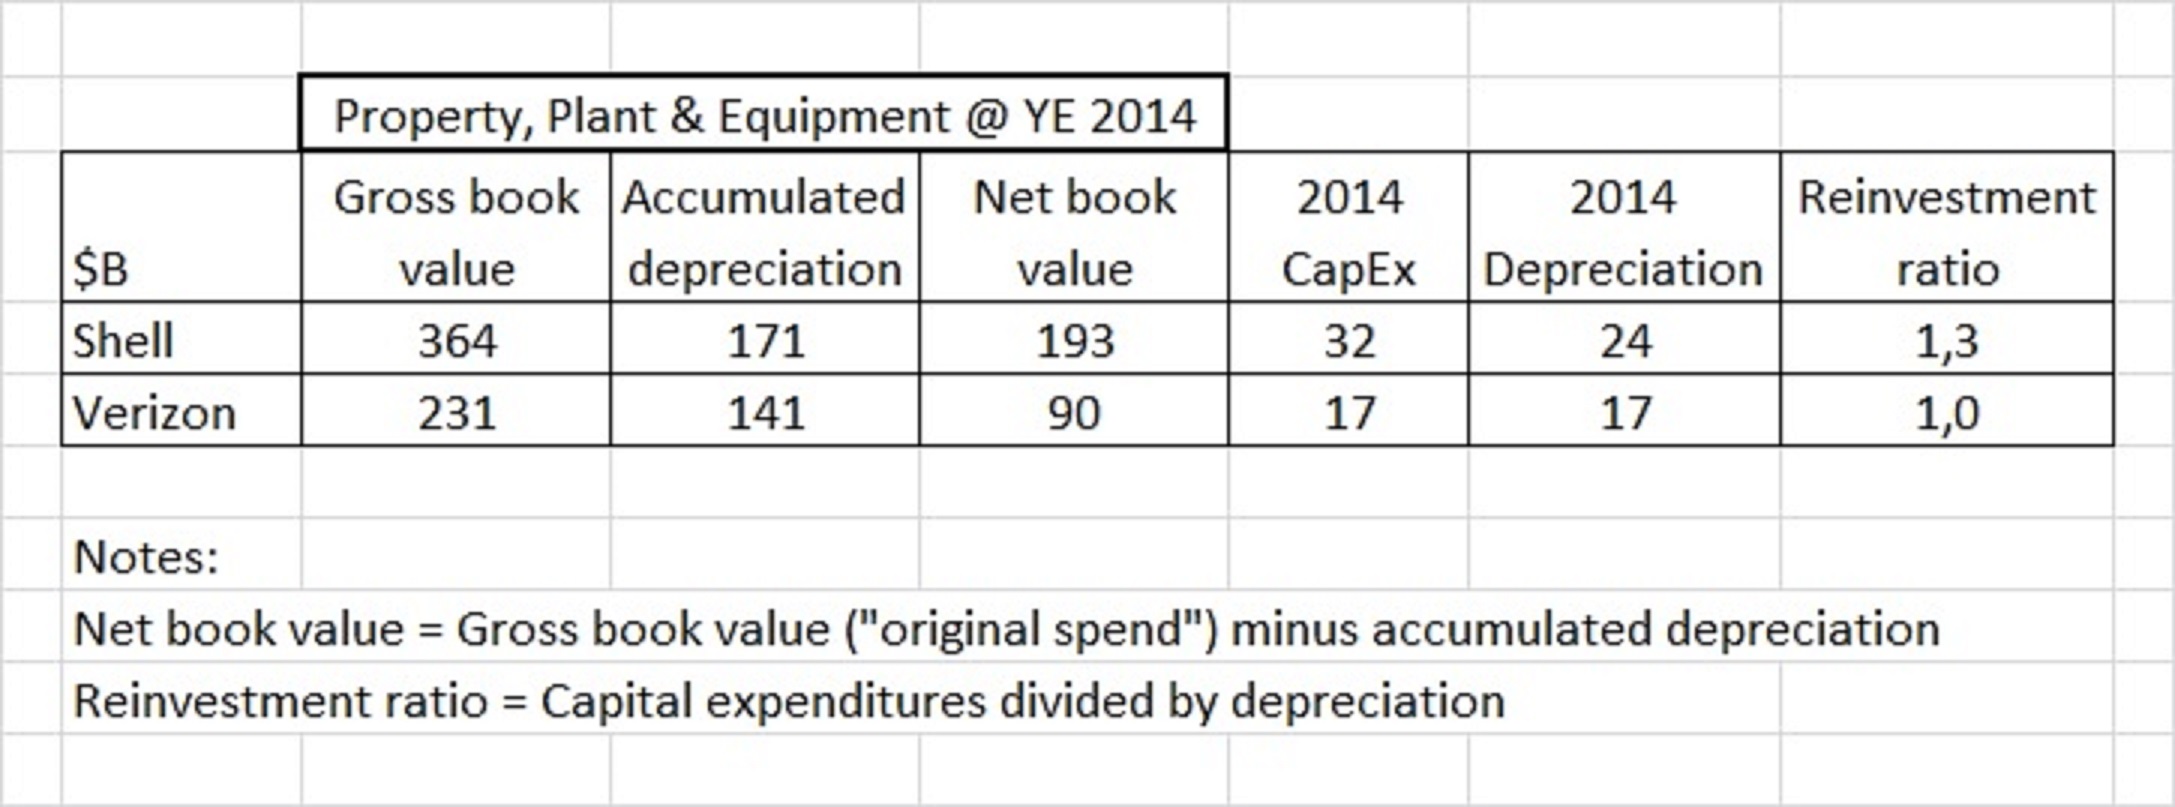
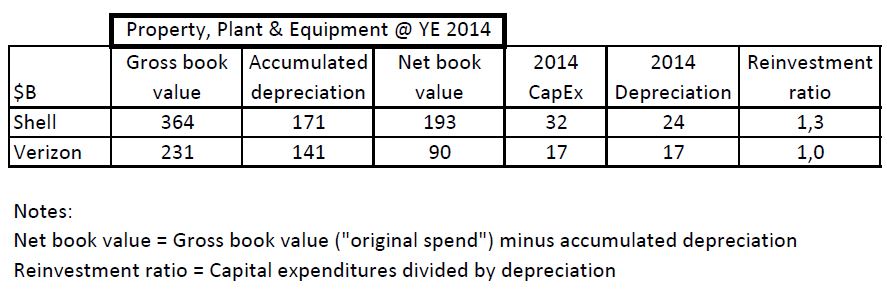
In terms of products and technology, oil and telecom companies are very different: finding, extracting and refining vast amounts of oil products, versus transmitting, securing and storing vast amounts of data. No overlap between these industries at all, at first glance. However, when you review the cash flow statement of companies in these respective industries, you find striking similarities. Let’s take Shell (the British-Dutch oil company) and Verizon (US-based telecom and networks company) as examples. Similar characteristics apply to their industry peers like BP and AT&T.
Both Shell and Verizon are very capital-intensive companies. They have huge amounts of fixed assets (property, plant and equipment) on their balance sheet: Shell at $193B net book value per year-end 2014, and Verizon at $90B. To add to that, both companies have significant capital expenditures (CapEx, fixed asset investments during the year), which is a huge cash outflow every year. For Shell $32B of capital expenditures in 2014, and Verizon $17B.
Both Shell and Verizon are very well known and respected as high dividend yield companies. They have a reputation for being highly dependable for paying quarterly dividends in cash to their shareholders, which appeals to large groups of investors, versus a share price that is fairly stable with few variations and hardly ever any dramatic surprises (positive, or negative). The very large dividend payments of $9B for Shell in 2014 and $5B for Verizon (and occasional share repurchases in times of excess cash) create a very significant annual cash outflow.
Where do these companies get the cash inflow to finance the capital expenditures cash outflow and the dividend cash outflow? Until recently, both Shell and Verizon were blessed with a very healthy inflow of cash from operating activities of $45B and $31B respectively (roughly: customers paying the company, minus what the company pays in salaries to employees, invoices to suppliers and taxes to the government), which easily covered the cash from investing and cash from financing activities outflow.
All was well in the oil industry until 2015. Then, oil prices continued to drop dramatically (from an average of $100 per barrel in 2014 to $55 in the first months of 2015), which hurts the operational cash flow at oil companies hard. In Shell’s case, every change of $10 in the oil price impacts cash flow by $3.3B.
All was well in the telecom and network industry until 2015. Then, the auction of spectrum licenses in the US (enabling the next generation of wireless technology) turned out to be a very competitive event, with AT&T spending $18B and Verizon $10B. Not everyday expenses, and not an amount of cash that even a large and cash rich company like Verizon has lying around (well, unless you want to completely deplete your cash balances, which is not advisable as you have no money left for business continuity, i.e. to pay your employees and suppliers, and continue your investments).
So how have Shell and Verizon “solved” their cash flow problem in 2015? Neither company wanted to cut its dividends (cash payments to shareholders), as this would hurt its reputation as a predictable and dependable dividend paying stock. Neither company wanted to significantly restrict its spending on capital expenditures, as investing less now would hurt its ability to compete in the future. Shell has significant borrowing capacity and a AA/Aa1 rating, and can easily borrow an incremental ten billion GBP at very favorable interest rates (which it has done), while Verizon is fairly “maxed out” on borrowing (with a BBB+ rating) after its purchase of the Vodafone share in its wireless business in 2014 (raising $49 Billion in the largest corporate-bond sale ever, as one of the ways to finance the $130B deal). Both Shell and Verizon are selling off non-core assets, in the case of Verizon $15B in two major transactions in early 2015.
In every company around the world, the cash needs to flow. Without cash, it’s game over, and as existentialist philosophers have correctly remarked “existence precedes essence”. What can we learn from the oil and telecom industries? In industries where companies need to continue to invest very significantly every year in order to build capacity and/or a technological competitive advantage, and investors are conditioned to expect large stable dividend payments, you need to generate incoming cash flow to keep operating. You can either borrow more (to a limited extent) to finance your business, sell assets (to a limited extent) to free up cash, or most importantly maximize the operational cash flow by improving profitability, and managing working capital (receivables, inventory, payables) carefully. If you want to know which decisions a company is making, what the sources and uses of its cash are, then watch its cash flow statement carefully. It is vastly underrated versus its more popular next of kin, the income statement.