I often contemplate the nature of reality. Even, or maybe especially, when I review a company’s public proclamations about its financial performance. What is fact and what is fiction? Is somebody trying to put a “spin” on the story? “Objects in the rear view mirror are closer than they appear”….
Fair and accurate representation
When reading earnings releases and annual reports, it is important to realize that companies are required under accounting regulations (and are hopefully intrinsically/ethically driven) to provide financial statements that are a “fair and accurate representation” of the company’s financial position, results of operations and cash flows. These financial statements inherently include “some amounts that are based on management’s best estimates and judgments”. Finance is more an art than a science. Companies that are “listed” (their equity or debt is tradable on stock exchanges), use either US GAAP or IFRS (depending on where they are listed (US or Rest-Of-the-World)) to guide their (subjective) interpretation of the complex operational reality.
So far, so good. Financial statements are put together using judgments and subjectivity. That’s not necessarily the area where I have surreal experiences when trying to inform myself about a company’s success (or lack of it) through studying its earnings releases and annual reports. I get very cautious, as well as excited to uncover the underlying data and “truth”, when I get to those parts of the information where a “spin” is put on the facts: sections such as the “letter to the shareholders”, the 1-page graphical summary showing 5 to 7 key indicators, or the PowerPoint slides provided with the earnings call. Let me discuss several areas where “reader beware” applies. Disclaimer: I am not “accusing” any of these companies of misstatements or of misinforming shareholders, just pointing out that there are cases where information is provided that might be factually correct, but where shareholders that fail to inform themselves about the broader context of these facts might draw the wrong conclusions.
Beware of the time horizon
GE is a great company to study and follow. Always executing multiple big strategic initiatives at the same time, and transforming the business portfolio by making bold moves. The earnings releases and investor outlook meetings are significant events in my calendar. You do however need lots of background knowledge about the company to properly judge some of the statements made.
GE example #1 is the 2Q 2011 earnings release comment on the execution of the capital allocation plan, with a factually true claim of having announced a “third dividend increase, up 50% since 2Q 2010”. Mathematically, this is completely correct: on July 23, 2010 the first increase (from $0.10 to $0.12 per quarter) was announced, then on December 10, 2010, the second one (from $0.12 to $0.14), and on April 21, 2011, the third one (from $0.14 to $0.15). However, this statement omits the 68% dividend cut announced in February 2009, from $0.31 per quarter to $0.10 per quarter. So yes, a multi-step dividend increase from $0.10 to $0.15 does equal a 50% improvement, but it is at the same time still down more than 50% from the “pre-cut” levels. In late 2014, the dividend is at $0.22 per quarter, a further increase versus the lowest point in 2009, but still not back at 2005 to 2009 levels.
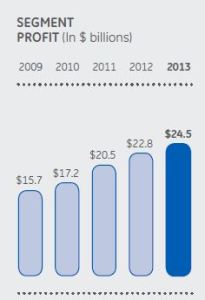
GE example #2 is the segment profit graph from the 2013 annual report. It covers the 2009-2013 timeframe, and shows an impressive increase of $8.8B or 56% from $15.7B (2009) to $24.5B (2013). The graph omits the detailed split between the key segments, which would have shown you that the industrial businesses “only” went up by $1.8B over these years, while most of the increase comes from GE Capital going from marginal profitability in 2009 of $1.4B to much healthier profitability levels in 2013 of $8.3B. A key data point to know for investors, which is not provided in the graph of page 1, but in the summary of operating segments on page 42. Furthermore, the graph uses the common 5-year comparison, whereas a broader 7-year comparison would have told you that segment profit was a stunning $25.6B in 2007. In other words: yes, GE has shown significant profitability improvement in the 2009-2013 timeframe, but its profitability in 2013 is not yet back at pre-crisis 2007 levels.
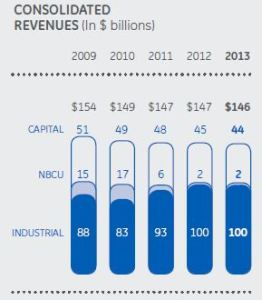
GE example #3 is the 5-year revenue graph from the 2013 annual report. It shows GE’s revenue shrinking from $154B in 2009 to $146B in 2013, and suggests that this is largely due to having NBCU as a fully owned subsidiary in the past (contributing $15B revenue in 2009) to a minority shareholding and subsequent full sale to Comcast (contributing a final $2B in revenue in 2013, i.e. a drop of $13B over the 5-year period), plus the deliberate shrinking of the GE Capital business portfolio (causing a $7B drop in revenue). These statements are factually true, but firstly omit the context of the 7-year overview where GE historically had a much higher 2008 revenue of $180B (!) including NBCU, and $163B excluding NBCU. Secondly, the incremental revenue impact of acquisitions like Converteam, Dresser, Wood Group Well Support, Wellstream, Clarient, Lufkin and Avio is not mentioned or split out. If you split out the revenue impact of a significant divestment like NBCU, shouldn’t you split out the positive revenue impact of the acquisitions in the same graph?
Beware of “non-GAAP” supplemental information
Companies in the healthcare sector tend to be highly profitable in most years (EBIT margins in the 15-20% range), but have very volatile earnings. Many of these companies provide “non-GAAP” supplemental information, stating that the alternate figure more accurately reflects their company’s performance. In most cases, this means isolating “unusuals” or “special items” from the performance: common examples are litigation charges and settlements, product recalls, restructuring costs, acquisition-related charges. The non-GAAP (“after clean-up”) profit in almost all cases is higher than the GAAP profit (what the official accounting rules tell you to report).
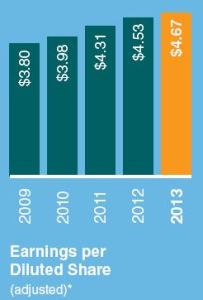
Baxter provides a graph every year of “Earnings per Diluted Share (adjusted)*”, a nice smooth graph of steadily increasing EPS. Earnings per Share is a fairly straightforward metric: total net income divided by the number of outstanding shares. Repurchasing of shares by a company can have a huge effect, as it decreases the denominator in the equation. In Baxter’s case, the adjustment of the numerator (earnings, or net income) has a much bigger effect. In 2010, the net income was $1.4B, while the non-GAAP profit (excluding special charges) was $2.4B, a difference of $1B. Strangely enough, this huge difference is not explained in any detail in the annual report, but there is some small print explaining the “*” mark: “Please see the company’s website at www.baxter.com for a reconciliation to earnings per diluted share.” My personal opinion in this is that companies should make these adjustments (on a line item basis) an integral and upfront part of their financial reporting.
A review of other companies (J&J, Abbott, Hospira, BD) in the healthcare sector showed that the significant size and number of non-GAAP items is common practice in this industry’s financial reporting. Hospira even turned a 2013 GAAP loss of $8MM into a $348MM non-GAAP profit by adjusting for 9 different special items.
Beware of euphemisms
The letter to the shareholders is a useful document to read, it informs you of the company’s strategy, accomplishments, and performance. Be careful with the wording, as euphemisms are sometimes used that should trigger a desire in the reader to dig more deeply into the actual financial performance. Just like the phrase “Mr X is pursuing opportunities outside the company” is often a nice way to say Mr X was fired, companies can use sentences like “….. created significant headwinds for the company. Despite these challenges, the company also enjoyed many accomplishments” to talk “around” the problem. This is the time to pause and dig into exactly what the size and impact was of those headwinds, and whether these headwinds were one-off or will continue to have an impact in the future, before turning to the accomplishments that are likely to be of a significantly smaller size.
“Objects in the rear view mirror are closer than they appear”
Annual reports and quarterly earnings releases should not just be legalistic documents that are mechanically filled in, with templates copied from the previous period where only the numbers updated. Any company should provide an accurate and full representation of the strategic, financial and business risk situation, both in letter as well as in spirit. Drawing selective attention to some items rather than others is not quite the same as lying, but I would not call it fully transparent either.


One reply on “Factually correct, contextually lacking”
it is all about market conception. The CEO/CFO for listed companies are in general “storytellers” the best storytellers who hit what they tell get rewarded. This means that not always the best performing companies get the highest values but the best storytellers who do it consistently.